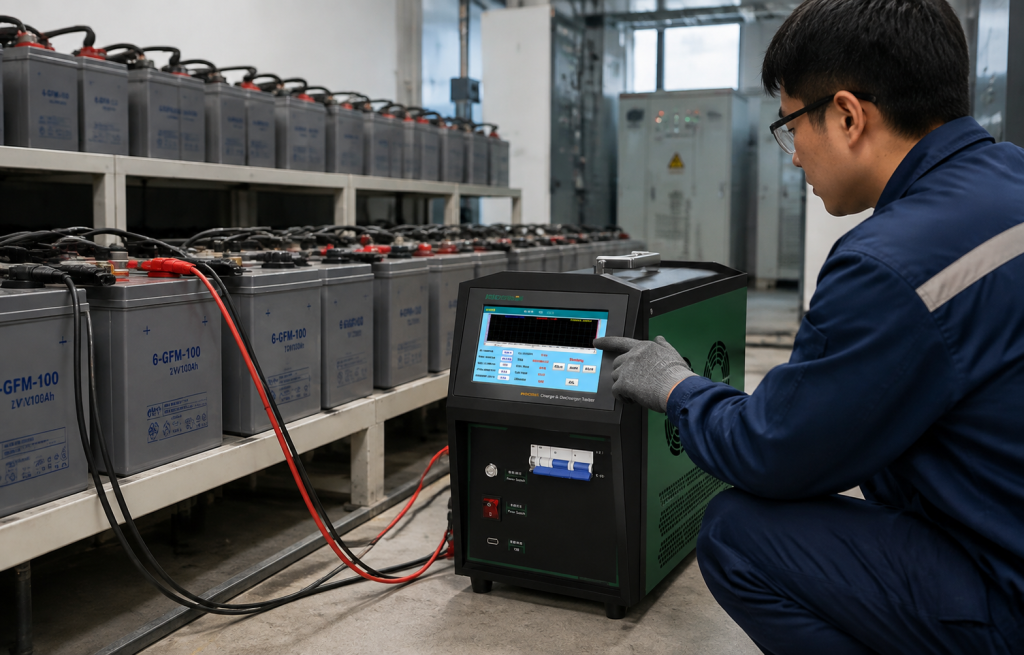
Lead-acid batteries remain essential components of backup power systems in substations, telecommunications facilities, data centers, industrial plants, and rail transit infrastructure. Their reliability depends not only on battery quality but also on regular inspection, appropriate charging, and accurate performance verification.
However, checking terminal voltage alone cannot provide a complete picture of battery condition. A battery may show an acceptable voltage at rest while delivering insufficient capacity under load. Likewise, a battery bank may appear operational even when individual cells have deteriorated or become unbalanced.
Lead acid battery charge discharge test data analysis helps maintenance teams interpret electrical measurements, evaluate available capacity, identify abnormal behavior, and make better-informed maintenance decisions. By combining controlled testing with systematic data analysis, engineers can move beyond routine visual inspections toward evidence-based battery maintenance.
-
Why Charge and Discharge Test Data Matters
A lead-acid battery stores chemical energy and converts it into electrical energy when a load is connected. During charging, electrical energy restores the battery’s stored energy. During discharging, the battery supplies current to connected equipment.
Both processes generate valuable diagnostic information. Charging data can reveal whether the battery responds appropriately to the charging process, while discharge data helps assess its ability to deliver energy under specified conditions.
For industrial battery systems, test data supports several important maintenance objectives:
Capacity verification: Determine whether a battery can deliver the required capacity under defined test conditions.
Performance comparison: Compare results from different maintenance periods to identify deterioration.
Abnormality detection: Identify unusual voltage drops, inconsistent cell behavior, or unexpected charging responses.
Maintenance planning: Use measured results to prioritize inspections, further testing, or replacement decisions.
Documentation: Maintain traceable records for maintenance reviews, technical audits, and reliability management.
These benefits are especially important for standby batteries. A battery may remain unused for extended periods, yet it must provide dependable power when the main supply fails.
-
Key Parameters in Lead Acid Battery Charge and Discharge Testing
Accurate analysis begins with understanding what each measurement represents. No single parameter should be used in isolation to determine overall battery health.
2.1 Battery Voltage
Voltage is one of the most accessible indicators of battery condition. During charging, terminal voltage generally rises as the battery accepts energy. During discharging, voltage typically decreases as stored energy is delivered to the load.
The interpretation depends on battery type, temperature, charging stage, discharge current, and measurement timing. A voltage reading taken immediately after charging may differ from the stabilized open-circuit voltage.
For battery banks, individual cell or unit voltage measurements can reveal abnormalities hidden by the total bank voltage. A weak cell may experience a greater voltage drop than neighboring cells under the same discharge conditions.
2.2 Discharge Current
Discharge current indicates the electrical load applied to the battery. Constant-current testing maintains a specified current during the test, making it easier to compare results when the test conditions are consistent.
If discharge current fluctuates unexpectedly, the resulting capacity calculation and voltage curve may become difficult to interpret. Engineers should therefore confirm the selected discharge mode, current setting, instrument accuracy, and connection quality before evaluating the results.
2.3 Discharge Time
Discharge time records how long the battery sustains the specified load before reaching the defined termination condition.
A shorter discharge duration than expected may indicate reduced available capacity, increased internal losses, an unsuitable test current, or another abnormal operating condition. Comparisons are meaningful only when the discharge rate, initial battery condition, temperature, and termination voltage are appropriately controlled.
2.4 Discharged Capacity
For a constant-current discharge, delivered capacity can be calculated as:
Capacity (Ah) = Discharge Current (A) × Discharge Time (h)
For example, a battery discharging at 20 A for 4 hours delivers 80 Ah during that test.
When current varies over time, delivered capacity should be calculated by integrating current over the discharge period or by summing the measured current over appropriate time intervals.
Measured discharge capacity should be compared with the rated capacity under the manufacturer’s specified discharge rate, temperature, and final voltage. A test conducted at a different discharge rate may produce a different result, so direct comparisons without accounting for these conditions can be misleading.
2.5 Temperature and Individual Cell Voltage
Temperature affects battery performance and charging behavior. Abnormal heating during charging or discharging may indicate excessive current, poor connections, battery deterioration, or other problems requiring investigation.
Individual cell voltage is also important in series-connected battery banks. Even when the total bank voltage appears normal, one or more weak cells may reduce the reliability of the complete system.
-
How to Interpret Charge and Discharge Curves
A charge or discharge curve displays measured voltage against time, and sometimes current, temperature, or other parameters. Examining the overall curve helps engineers understand battery behavior throughout a test rather than relying on a single reading.
3.1 Normal Discharge Behavior
During a controlled discharge, battery voltage typically falls relatively quickly at the beginning, remains within a more gradual decline region, and then decreases more rapidly as the battery approaches its discharge endpoint.
The exact curve depends on battery design, condition, load, temperature, and discharge rate. A normal curve should therefore be evaluated against manufacturer specifications and suitable historical test records rather than a universal visual template.
3.2 Rapid Voltage Drop
An unusually steep voltage decline near the beginning of a discharge may suggest a weak battery, elevated internal resistance, a high load, poor connections, or insufficient initial charge.
Before concluding that the battery has failed, engineers should verify the current setting, cable connections, starting conditions, and measurement accuracy. Additional testing may be necessary to distinguish a battery problem from an external connection or load issue.
3.3 Premature Discharge Termination
If a battery reaches its specified final voltage earlier than expected, its available capacity under the test conditions may be lower than required.
For a series-connected bank, an individual weak cell can reach its lower voltage limit before the remaining cells. This is one reason individual cell monitoring can provide useful diagnostic information alongside total bank voltage.
3.4 Abnormal Charging Response
During charging, voltage and current should be interpreted according to the selected charging method. In constant-current/constant-voltage charging, current behavior changes as the battery approaches the regulated voltage.
Unexpected voltage increases, prolonged charging, excessive temperature, or inconsistent responses between battery units may justify further inspection. Charging data must be assessed against the battery manufacturer’s requirements and the applicable charging procedure.
-
How to Evaluate Battery Capacity Test Results
Capacity evaluation is one of the most important applications of charge and discharge data analysis.
A practical comparison can be expressed as:
Capacity Ratio (%) = Measured Capacity ÷ Rated Capacity × 100%
Suppose a battery rated at 100 Ah delivers 82 Ah during a test conducted under the applicable rated-capacity conditions. Its measured capacity ratio is 82%.
This result describes the outcome under those specific conditions. Whether the battery is acceptable depends on the manufacturer’s specifications, the system’s operational requirements, and the relevant maintenance criteria.
Engineers should avoid using a single percentage as a universal replacement threshold for every battery type and application.
A reliable evaluation process should consider:
- Rated capacity and test conditions: Confirm the applicable rating, discharge rate, temperature, and termination voltage.
- Delivered capacity: Calculate the measured ampere-hours or obtain the value from the test instrument.
- Historical performance: Compare the result with previous tests performed under comparable conditions.
- Individual unit behavior: Identify cells or battery units whose voltage response differs significantly from the rest of the bank.
- Operational requirements: Determine whether the available capacity is sufficient for the required backup duration and load.
Some testing systems provide rapid capacity analysis based on measured electrical characteristics. Such results can support preliminary assessment and maintenance prioritization, but they should not automatically be treated as equivalent to a complete controlled discharge capacity test unless the method has been validated for that purpose.
-
Common Data Analysis Mistakes
Even when suitable testing equipment is available, inconsistent procedures can lead to misleading conclusions.
Comparing Results from Different Test Conditions
Capacity results are affected by discharge current, temperature, initial charge state, and termination voltage. Comparing results without accounting for these variables may create the appearance of deterioration or improvement that is not directly attributable to battery condition.
Relying Only on Total Bank Voltage
The total voltage of a battery bank can conceal weak individual cells. Where appropriate, individual cell or unit measurements should be included in the inspection and analysis process.
Ignoring Connection Resistance
Loose, corroded, or damaged connections can produce voltage drops and heating that affect measurements and system reliability. Connection integrity should be checked using appropriate safe procedures before attributing abnormal readings to the battery itself.
Failing to Maintain Historical Records
A single test describes performance at one point in time. Repeated measurements under comparable conditions provide a more useful basis for identifying trends, evaluating maintenance effectiveness, and planning future inspections.
Treating Every Abnormal Reading as a Replacement Decision
An unusual result should trigger investigation, not an automatic conclusion. Engineers should verify the measurement, review test conditions, inspect connections, and conduct further tests when necessary before making maintenance or replacement decisions.
-
A Practical Workflow for Reliable Test Data Analysis
A consistent workflow improves repeatability and helps maintenance teams produce useful records.
Step 1: Prepare the battery system. Identify the battery type, rated capacity, nominal voltage, configuration, and applicable test requirements. Confirm that the system can be tested safely and that any necessary backup arrangements are in place.
Step 2: Inspect the battery bank. Check for visible damage, leakage, corrosion, abnormal temperature, and connection problems. Follow the manufacturer’s safety instructions and site procedures.
Step 3: Configure the test parameters. Select the appropriate charging or discharging mode, current, voltage limits, and recording intervals according to the battery specifications and intended test.
Step 4: Monitor the test. Record voltage, current, elapsed time, temperature where available, and individual cell measurements where required. Stop the test if a safety limit or abnormal condition is reached.
Step 5: Analyze the results. Calculate delivered capacity where applicable, review the voltage curve, identify abnormal readings, and compare the results with specifications and previous records.
Step 6: Generate a report. Document the battery identification, test conditions, measured values, calculated results, abnormal findings, and recommended follow-up actions.
Step 7: Plan the next action. Depending on the findings, the appropriate response may be continued monitoring, connection maintenance, additional diagnostic testing, or battery replacement.
-
Choosing Equipment for Charge and Discharge Data Analysis
Reliable analysis depends on both the quality of the measurements and the capabilities of the testing equipment. For industrial lead-acid battery applications, useful features may include controlled discharge, configurable charging modes, voltage and current monitoring, protective limits, data storage, and report generation.
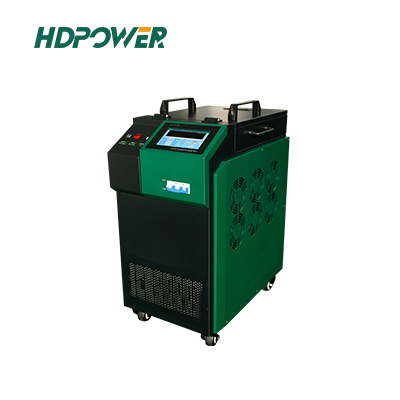
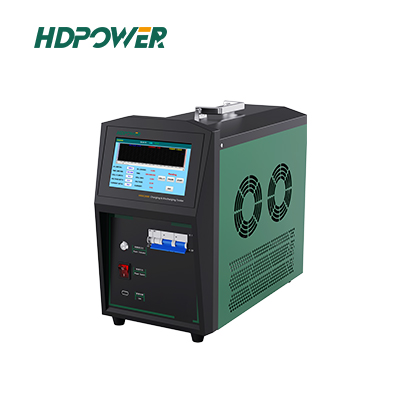
A dedicated Battery Charge Discharge Tester can help maintenance teams perform charging and discharging operations with consistent settings and organized test records.
When comparing equipment, consider the required voltage range, current capacity, charging functions, measurement accuracy, protection mechanisms, data export options, and suitability for the battery bank under test.
For applications involving substations, telecommunications backup systems, UPS installations, and industrial DC power supplies, an integrated tester may reduce the need to coordinate separate charging, discharging, and recording instruments.
HDPOWER’s HDGC3985 Battery Charge and Discharge Tester is designed for lead-acid battery maintenance applications. Its functions include controlled-current discharge, intelligent charging, configurable test parameters, protective functions, and test data reporting. Depending on the selected operating mode and application, these capabilities can support a more structured maintenance workflow.
Learn more about the HDGC3985 Battery Charge and Discharge Tester to review its functions and determine whether it suits your battery testing requirements.

-
Improving Battery Maintenance Through Data-Driven Decisions
Effective battery maintenance requires more than collecting voltage readings. Engineers need to understand how the battery responds under defined conditions, how its measured capacity compares with requirements, and whether its performance changes over time.
Consistent charge and discharge testing, individual cell monitoring where appropriate, and well-organized reporting can help identify developing problems before they compromise backup power reliability.
The most useful data is comparable, traceable, and interpreted in context. By combining appropriate testing procedures with reliable equipment and historical records, maintenance teams can make better-informed decisions about inspections, corrective actions, and replacement planning.
For organizations responsible for critical industrial battery systems, investing in a repeatable testing and analysis process can strengthen maintenance management and improve confidence in backup power readiness.
Need a solution for industrial lead-acid battery testing? Explore HDPOWER’s Lead Acid Battery Testers and contact the technical team to discuss your application, battery specifications, and testing requirements.